
After hitting fresh highs in October, US markets (and my own portfolio) have finally started to slide.
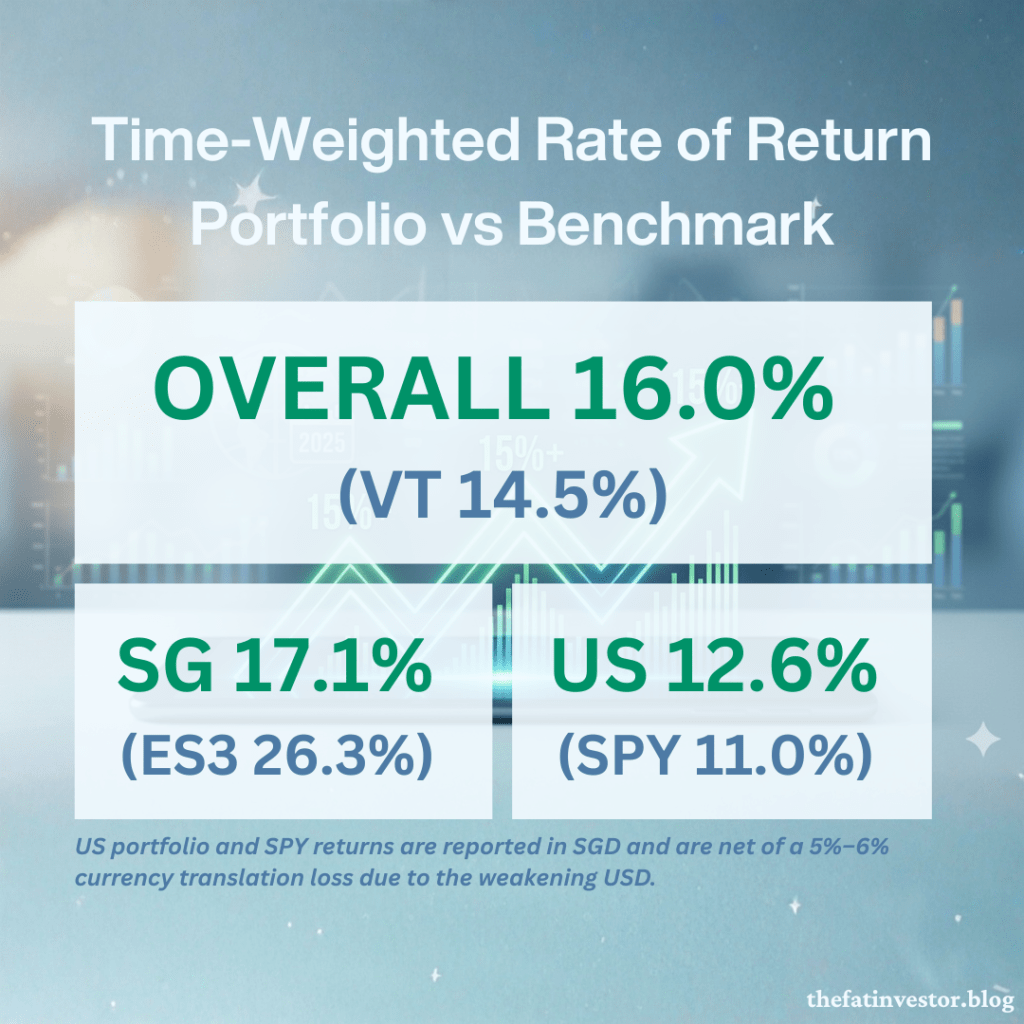
As a long-term investor, I’m unfazed by these late-year wobbles. Instead, I’m choosing to celebrate a milestone: another year of robust performance with an overall return of nearly 17% (XIRR).
Given the global turmoil, especially the gut-wrenching volatility following the “Liberation Day” Tariffs in April, I certainly didn’t expect to be sitting on such a strong result.
It’s a powerful reminder not to second-guess the markets, but to simply stay invested in quality businesses.
Of course, luck always plays a role, but as the saying goes, “luck is what happens when preparation meets opportunity“.
I’m giving myself a well-deserved pat on the back for the discipline that allowed me to ride that luck into my third consecutive year of above 15% returns!
Now, let’s take a look at how my individual portfolios and stocks performed.
A Mixed Bag. Mixed Emotions?
The numbers tell two different stories and they trigger a fascinating psychological tug-of-war.
On one hand, I get a significant ego boost as my US portfolio successfully beat the S&P 500 ETF (SPY). However, the same ego was wounded when my SG portfolio lagged behind the Straits Times Index ETF (ES3), or STI ETF, by a massive 10%.
The irony?
After accounting for the 5% to 6% USD/SGD currency translation loss, the SG portfolio actually delivered a higher net return than the US one.
Our brains are hardwired for comparison. Beating SPY provided a shot of dopamine, but that high was quickly soured by the underperformance against the STI ETF.
Take a pause for the emotions to settle.
You’ll realise it’s far more sensible for me to celebrate the SG portfolio. Even though it “lost” the race against its benchmark, it contributed more to my net worth than the “victorious” US side.
At the end of the day, I can’t spend “outperformance,” but I can spend a higher return.
SG Portfolio: Analysing the 10% Gap
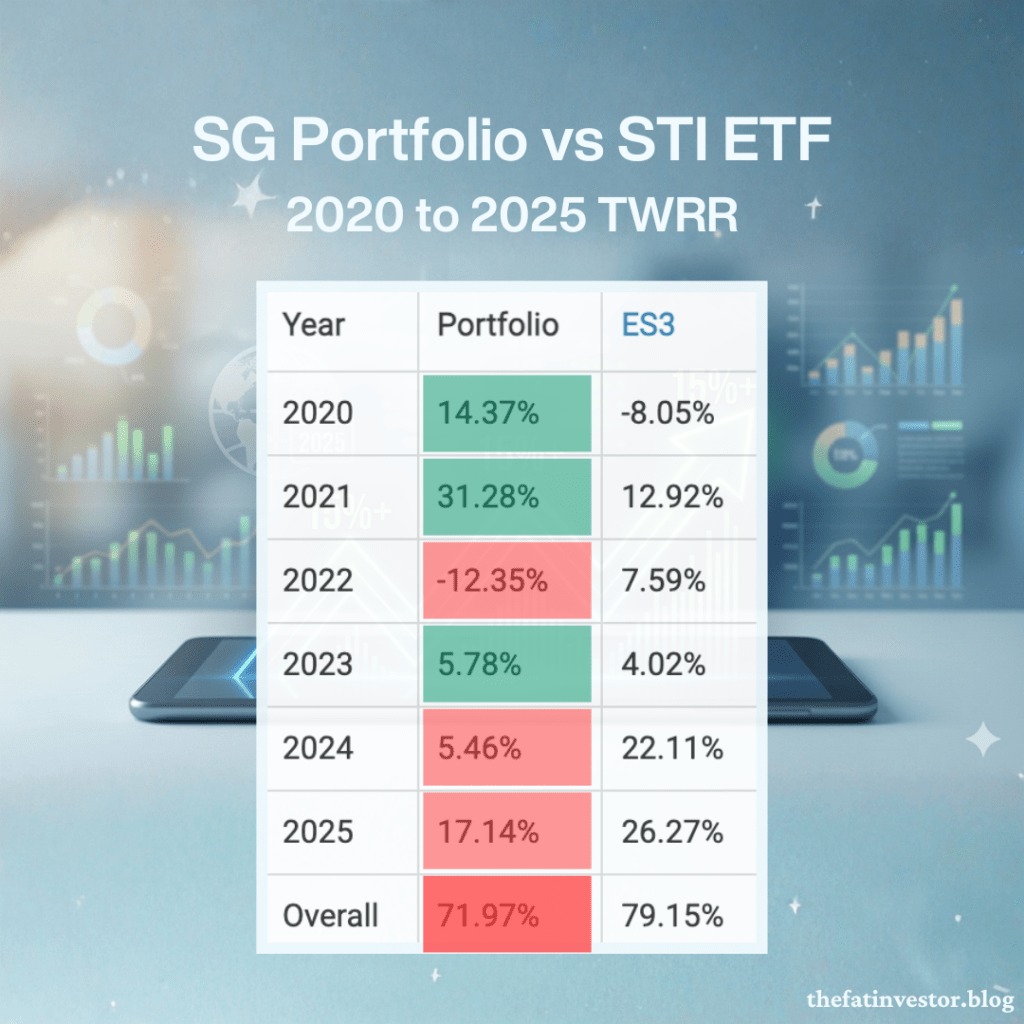
While the SG portfolio provided the strongest net gains for my wealth, it’s worth examining why it trailed the STI ETF so noticeably.
In fact, this is the third year out of the last four that I have underperformed against this “laggard” index, effectively wiping out the massive alpha I generated in the first two years.
What happened? Have I lost my mojo?
The answer lies in a simple but massive divergence in sector exposure.
The STI ETF is essentially a “Bank ETF” in disguise, with over 50% of its weight in the three local banks. Singapore REITs, or S-REITs, by contrast, make up only about 15% of the index.
My portfolio is almost a mirror image.
By cost, my concentration in S-REITs was as high as 40%, and banks took up only 19%.
The “higher-for-longer” interest rate cycle meant the three banks performed exceptionally well, while S-REITs faced significant headwinds.
This explains the bulk of the performance gap.
Despite this, I don’t believe in overhauling my portfolio just to chase interest rate trends; both S-REITs and Singapore banks serve a vital purpose as income generators.
While I do make strategic adjustments, the allocation evolves naturally.
At the time of writing, S-REITs now make up 32% of my SG holdings, while my exposure to the three banks has grown to 24%.
As we pivot toward lower interest rates, the very headwind that caused this underperformance could finally turn into a tailwind.
US Portfolio: A Hat-Trick of Outperformance

While underperforming the STI ETF over a six-year period was unexpected, beating the S&P 500 ETF three years in a row has been a pleasant surprise, especially since I am relatively new to the US markets.
It reminds me of my school days: scoring only a B3 in Geography (my stronger Humanities subject) but being stunned by an A1 in English Literature (my weaker).
The lesson is the same: results often come from where you least expect them.
I attribute this three-year winning streak to three key pivots:
- Flight to Quality: Switching out from speculative small-cap plays in 2022 to focus on large, profitable companies.
- The AI Tailwind: A strong showing from the technology sector fueled by the AI frenzy.
- Opportunistic Adding: Taking advantage of short-term price pressure to increase my stakes in quality companies.
Despite this strong showing, the higher volatility of the US markets still leaves me with a lingering sense of unease regarding sustainability.
However, the magic happens when you look at the big picture.
My US portfolio provides the growth “alpha”, while my SG portfolio provides the income “floor”.
Together, they create a diversified synergy that absorbs market shocks while keeping me firmly on track for a 10% annual return.
It’s this combined performance, rather than the success of any single market, that makes my financial goals attainable.
Of course, the big picture is made up of many moving parts.
In my next post, I’ll be lifting the hood to share the top and bottom performers of 2025, exploring the stories behind them.
Stay tuned!
Disclaimer
This content is for informational only. I am not a financial advisor, tax professional, or legal expert, and the information shared here does not constitute personalised financial advice, nor is it a solicitation to buy or sell any securities or financial instruments.
All opinions and commentary reflect my personal views and are based on general market commentary.
You are solely responsible for your own financial decisions. Investing involves risk, and any action you take based on the information provided on this blog or channel is strictly at your own risk.
Always conduct your own research and due diligence and consult with a qualified, licensed financial professional, tax professional, or legal advisor before making any investment or financial decision.
Discover more from The Fat Investor
Subscribe to get the latest posts sent to your email.
